Google Core Web Vitals was the co-lead story in our blog post from March last year. As a refresher, they are a set of metrics that assess a web page’s loading speed, interactivity, and visual stability. These metrics reflect how users experience a webpage in the real world. Having good Core Web Vitals is important not only for a positive user experience but also for potentially ranking higher in Google search results.
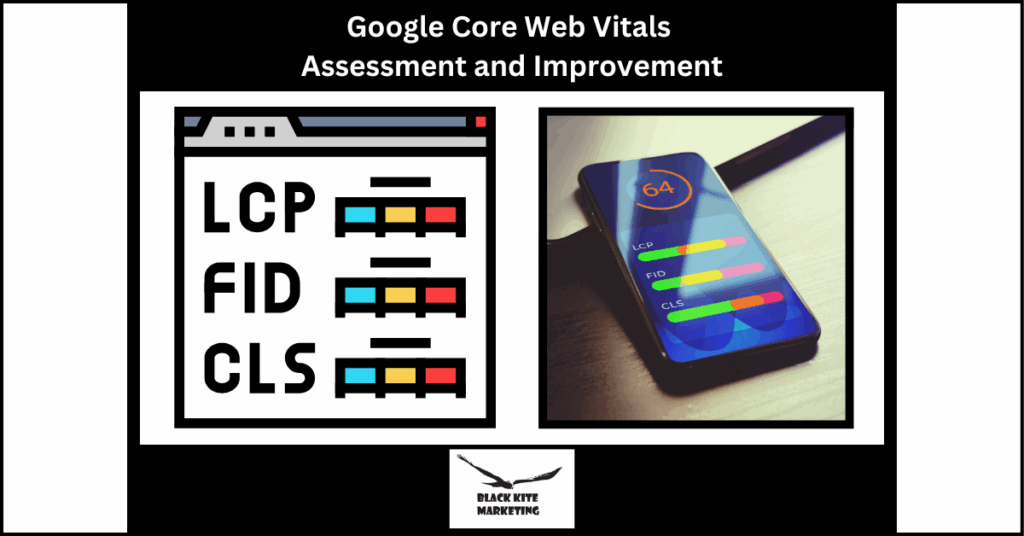
The three Core Web Vitals are:
- Largest Contentful Paint (LCP): This measures how long it takes for the largest element on your page to load.
- Interaction to Next Paint (INP): Measures how quickly the page responds to user interactions. This metric replaced First Input Delay (FID) in March 2024.
- Cumulative Layout Shift (CLS): This measures how much the content on your page moves around after it has initially loaded.
There are various tools available to help you measure and improve your Core Web Vitals, including Google Search Console and PageSpeed Insights.
Target Values for Core Web Vitals
Google provides specific guidelines for each Core Web Vital to help you understand what constitutes good, needs improvement, and poor performance.
Largest Contentful Paint (LCP):
- Good: LCP less than 2.5 seconds
- Needs improvement: LCP between 2.5 and 4 seconds
- Poor: LCP more than 4 seconds
Interaction to Next Paint (INP):
- Good: INP less than 50 milliseconds
- Needs improvement: INP between 50 and 100 milliseconds
- Poor: INP more than 100 milliseconds
Cumulative Layout Shift (CLS):
- Good: CLS less than 0.1
- Needs improvement: CLS between 0.1 and 0.25
- Poor: CLS more than 0.25
It’s difficult to say definitively what percentage of web pages fall outside the recommended thresholds for Core Web Vitals because compliance depends on the specific tool and how recently the data was gathered. However, based on industry reports, a significant portion of websites struggle to meet these metrics.
Here’s a general idea:
- Studies suggest around 90% of homepages and a slightly smaller percentage of product detail pages fail to meet Google’s LCP standards of loading in under 2.5 seconds for 75% of users.
- Estimates suggest that around 72.8% of websites have a good CLS score, below 0.1. This means that a significant portion, close to 30%, still have room for improvement to provide a more stable user experience.
It’s important to note that this data is from January 2025, and the landscape may have changed slightly. Additionally, this percentage is an average across all websites. There may be variations depending on the industry or website type.
Assessment tools for Core Web Vitals
Google Lighthouse
Lighthouse is a popular tool used for improving the quality of web pages. It runs performance audits including Core Web Vitals, as well as accessibility, SEO, and best practices. Lighthouse can be accessed via Chrome DevTools, the Lighthouse Chrome Extension, or as a Node.js module. It uses lab data (simulated loading data in a controlled environment), which makes it great for developers who want to debug and improve performance during the development phase.
PageSpeed Insights
Google PageSpeed Insights (PSI) is a free tool that analyzes the content of a web page and provides suggestions to make it faster. What sets it apart is that it combines both lab data (from Lighthouse) and field data (from the Chrome User Experience Report, or CrUX). The field data includes real-world performance collected from actual users, which makes PSI highly valuable for understanding how your site performs in the wild, across a range of devices and networks.
Google Search Console (GSC)
Search Console provides site owners with a broader view of their website’s performance in Google Search. GSC has a Core Web Vitals report that shows how pages perform based on real-world usage data. It categorizes pages as “Good,” “Needs Improvement,” or “Poor” for metrics like Largest Contentful Paint (LCP), First Input Delay (FID), and Cumulative Layout Shift (CLS). Unlike Lighthouse and PSI, GSC tracks performance over time and helps identify site-wide issues at scale.
Each of these tools has its own pros and applications:
- Lighthouse is ideal for developers needing actionable feedback during design and development using controlled tests.
- PageSpeed Insights is a good middle ground, offering both lab and field data for a specific URL, making it useful for spot-checking individual pages and seeing how users actually experience them.
- Google Search Console, on the other hand, is best for ongoing monitoring and prioritizing which URLs across your site need the most attention based on real-world data.
For best results, use all three together: start with GSC to find problem areas, use PSI to analyze individual URLs, and rely on Lighthouse to dig into technical details and fix issues during development.
How to Improve Core Web Vitals Score
Google Search Console Core Web Vitals report: https://support.google.com/webmasters/answer/9205520
It’s important to note that these are guidelines, and achieving the “good” level for all metrics is often challenging. Focus on improving your scores over time and prioritize the metrics that have the most significant impact on your users.
Out of the three Core Web Vitals, there’s a general consensus that:
- Easiest to fix: Cumulative Layout Shift (CLS)
- Most difficult or time consuming to fix: Largest Contentful Paint (LCP)
Here’s why:
- CLS (Cumulative Layout Shift): This metric focuses on visual stability. Issues often arise from elements loading asynchronously or having undefined dimensions. Fixing CLS typically involves code adjustments to ensure elements have proper sizing and load in a predictable order. In many cases, this can be achieved through code tweaks or using CSS techniques.
- LCP (Largest Contentful Paint): This metric deals with how long it takes for the largest content element to load. Factors affecting LCP can be diverse, ranging from image optimization and server response times to render-blocking resources like large JavaScript files. Optimizing LCP often requires a more holistic approach that might involve server-side configuration, code refactoring, and image optimization techniques.
It’s important to remember that these are generalizations. The difficulty of fixing a specific Core Web Vital issue depends on the underlying cause. However, due to the nature of the metrics, CLS issues are often more readily addressed through targeted code changes. LCP improvements, on the other hand, might require a more comprehensive website performance review and optimization strategy.
How Long Does It Take to See Results After Fixing Core Web Vitals Issues?
Once you’ve addressed the issues flagged by tools like Lighthouse, PageSpeed Insights, and Google Search Console, it’s natural to wonder when you’ll start seeing improvements. The timeline varies depending on the type of data each tool uses—lab data or field data—and how Google processes the changes.
Lighthouse & PageSpeed Insights (Lab Data)
Changes appear immediately when using Lighthouse or the lab data section of PageSpeed Insights. These tools simulate loading conditions in a controlled environment, so once your site is optimized and redeployed, you can re-run the tests and see the improvements right away. This makes them excellent tools for developers during the testing and QA stages.
PageSpeed Insights (Field Data)
The field data in PageSpeed Insights comes from the Chrome User Experience Report (CrUX), which collects metrics from real users. These insights are based on a 28-day rolling average, so it can take up to 28 days for your optimizations to reflect in the field data section. Keep in mind that if your site has low traffic, it might take longer for enough data to be collected.
Google Search Console (Core Web Vitals Report)
Like PSI field data, Google Search Console’s Core Web Vitals report also relies on CrUX. As a result, it can take around 28 days for improvements to show up here as well. This report is especially useful for monitoring site-wide performance trends and identifying whether a group of pages is still categorized as “Poor,” “Needs Improvement,” or “Good.”
Quick Summary
Instant results: Lighthouse and PSI lab data.
Up to 28 days: PSI field data and Google Search Console.
Pro Tip: To help Google register improvements faster, ensure your pages are crawlable, get re-indexed (use the URL Inspection tool in GSC), and receive consistent traffic.
Make Core Web Vitals Part of Your SEO Strategy
Improving your Core Web Vitals isn’t just about satisfying Google’s metrics—it’s about delivering a better experience for your users. While some optimizations offer quick wins, others require deeper technical work and time to reflect in performance reports. But the payoff is worth it: faster load times, better engagement, and improved search visibility.
If you’re unsure where to start or don’t have the resources to implement these changes yourself, Black Kite Marketing can help. We specialize in technical SEO and performance optimization strategies that move the needle for small and mid-sized businesses. From audit to implementation, we’ll guide you through every step of improving your Core Web Vitals and overall site performance.
Ready to boost your site speed and search rankings? Contact Black Kite Marketing today to schedule a free performance audit.